Comparison 05 of 10 · Earth
Traffic, set beside Google Maps and the TomTom Traffic Index
A road-speed desk built only from open city feeds, which throws away anything that is not a measurement. The rivals do more — incidents, travel times, a year of rankings; this one tells you exactly what it withheld.
- Under test
- labs.llc/traffic/
- Measured
- 27 Sep 2026, 20:00–20:04 UTC, local copy of build 537
- 0 labs.llc ahead
- 4 a rival ahead
- 1 level
- 3 unconfirmed
1What it is, and who it is for
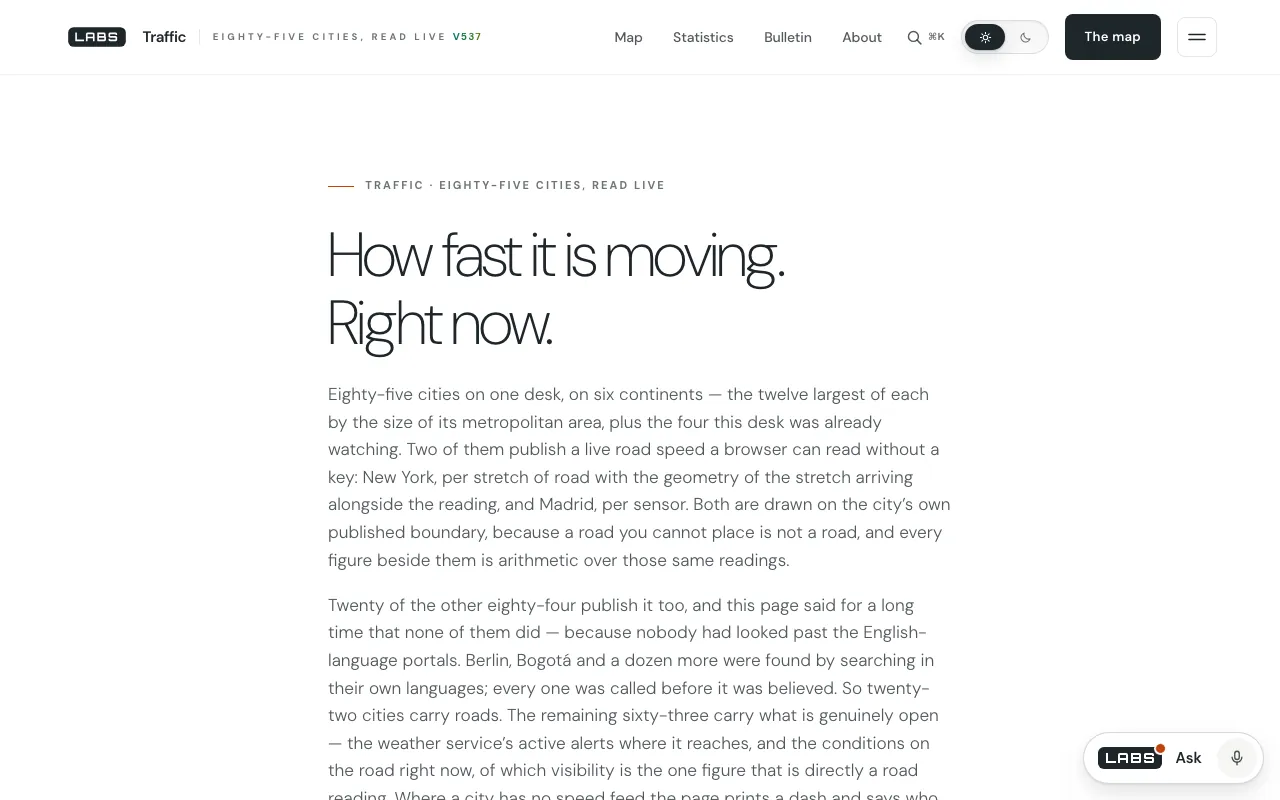
Traffic is a road desk for eighty-five cities on six continents. Twenty-two of them carry live road speeds drawn as roads on the city's own boundary: New York and Madrid read straight from the city feeds, twenty more through a relay. The other sixty-three carry what is genuinely open for them — weather-service alerts where they exist, and current conditions, visibility above all.
It is for commuters and travellers who want to see how a city's main roads are moving now, and for anyone curious which cities publish open traffic data at all.
2How it works
The browser reads New York City DOT speeds from NYC Open Data (dataset i4gi-tjb9, newest 1,200 rows; cities.js:649–656) and Madrid's sensor file from informo.madrid.es, converting Madrid's UTM coordinates with a hand-written inverse Transverse Mercator (app.js:1249–1262). Clicking a New York stretch fetches its last twenty-four hours.
Twenty cities come through traffic/speeds-proxy.php, a relay with a fixed register of cities and upstreams — Addinsight for eleven Australian and New Zealand cities, VIZ Berlin, Geneva, Bonn, TxDOT and Waze for Austin and San Antonio, Virginia Beach, Seoul TOPIS, Houston TranStar and Bogotá SIMUR (lines 66–165). The relay exists for size and for honesty: it thins Berlin's 19,457 links to the arterial class, drops links the Australian platforms flag as modelled and the 300 km/h no-reading placeholder, and clips shared feeds to each city's box (10–45, 261–265). New York readings with a bad status or over 85 mph are kept out of the drawing and the averages, and the count of silent detectors is shown (app.js:1420–1442). Conditions come from Open-Meteo and US alerts from api.weather.gov. The maps are drawn by the page: no tile provider, no mapping library, no key.
3The test
Requests to the relay went through the local copy of build 537; the New York feed was fetched as the browser would build it. 27 September 2026, UTC.
| UTC | What | What came back |
|---|---|---|
| 20:00:36 | Relay — Berlin | HTTP 200, 499,956 bytes, 0.81 s: 1,528 arterial links fetched, 1,476 live. Credit line VIZ Berlin. |
| 20:00:38 | Relay — Melbourne | HTTP 200, 671,572 bytes, 2.11 s: 4,707 links fetched; 1,753 live drawn; 2,533 flagged modelled and 8 placeholders withheld; 413 outside the city box. |
| 20:00:42 | Relay — Houston | HTTP 200, 178,087 bytes, 0.37 s: 807 fetched, 706 live, 101 placeholders withheld, in mph. |
| 20:00:41 | Relay asked for Paris | HTTP 404: “No speed feed is wired for that city.” Not an open proxy. |
| 20:03:58 | NYC DOT feed | HTTP 200, 346,983 bytes, 0.33 s: 1,200 rows over 125 links; 50 of the 125 newest readings had status −101 (not reporting). Newest stamp 13:31:05 while it was 16:03 in New York — about 2½ hours old if the unzoned stamp is local time. |
4The checklist
Eight checks. The rivals are a different kind of product — a map layer and an annual index — so several rows go their way by design. The rows Traffic wins are about what it will not show.
- Yes: does it
- Partly: partly — read the note
- No: does not
- Not checked: not checked: no claim either way
- Not applicable: does not apply
| Check | labs.llc · under testTraffic | rivalGoogle Maps traffic layer | rivalTomTom Traffic Index |
|---|---|---|---|
| Current road conditions on a mapRival ahead | Partly1 | Yes2 | Not checked3 |
| Speed as a number for each stretchUnconfirmed | Yes4 | Not checked5 | Not applicable |
| Says where each reading comes fromLevel | Yes6 | Not checked | Yes7 |
| Withholds modelled or placeholder readingsUnconfirmed | Yes8 | Not checked | Not checked |
| Incidents: crashes, construction, closuresRival ahead | No | Yes | Not checked |
| Travel time from a pointRival ahead | No | Yes9 | Not checked |
| A year of congestion, ranked across citiesRival ahead | No | Not checked | Yes10 |
| Visibility and weather alerts where speeds are closedUnconfirmed | Yes | Not checked | Not checked |
- 1Roads for 22 of 85 cities; the rest get alerts and visibility.
- 2Green, orange and red for delay, “the darker the red, the slower the speed”.
- 3The page we fetched is a yearly ranking; whether TomTom shows live conditions elsewhere was not checked.
- 4Plus 24 hours of history for any New York stretch (app.js:2725–2745).
- 5The help page describes colours; we did not test the app for numbers.
- 6A credit line per city (speeds-proxy.php:66–165).
- 7TomTom's own minute-by-minute monitoring.
- 8Melbourne: 2,533 modelled links withheld on the day.
- 9A separate Travel Time layer.
- 10The 15th edition, ranking states, cities and countries.
Does better
Google Maps traffic layer
- One colour-coded traffic layer on the same map as everything else.
- Crashes, construction and road closures marked on the map.
- A Travel Time layer: how far you can get from a point in a given time.
Does better
TomTom Traffic Index
- Comparable congestion figures for hundreds of cities worldwide.
- A year of history per city, ranked — New York at 28% on the page we fetched.
Goes further
Traffic
- Throws out what is not a measurement and shows the count: 2,533 modelled links and 8 placeholders in Melbourne, 101 placeholders in Houston.
- Counts New York's silent detectors — 50 of 125 in our sample — instead of averaging them in.
- Looked past the English-language portals — Berlin, Bogotá and a dozen more feeds were found by searching in their own languages — and names each feed with its credit line.
- Draws its maps without a tile service or key; the relay refuses any city it does not know.
5Where Traffic falls short
- Roads for twenty-two of eighty-five cities only; the other sixty-three get conditions and alerts, not traffic.
- No routing, no travel-time estimate and no incident reports.
- It can be no fresher than the city's feed: the newest New York reading looked about two and a half hours old, and 50 of 125 detectors were silent.
- The estate's own register still says “seventy-six cities” (assets/js/portfolio-data.js:694) while the page says eighty-five.
6The verdict, by the checklist
Choose Traffic to see measured speeds from a city's own open feed, with the unmeasured parts left out on purpose; choose Google Maps to get somewhere, and TomTom to compare cities over a year.
If the question is “how do I get there?”, the checklist says Google Maps, plainly. Traffic is answering a different question — what the public agencies actually measured, and nothing they did not — and on that it goes further than either rival page describes: it counts and discloses what it withheld. The trade is coverage.
Try Traffic on labs.llc