Comparison 04 of 10 · Markets
Rates, set beside FRED and Freddie Mac's own survey page
A desk that reads the New York Fed, the Treasury and Freddie Mac and labels the one number it has to infer. Its figures matched both publishers on the day; its history is slower to arrive.
- Under test
- labs.llc/rates/
- Measured
- 27 Sep 2026, 20:00–20:03 UTC, local copy of build 537
- Rivals
- FRED, series T10Y2Y · Freddie Mac PMMS
- 1 labs.llc ahead
- 3 a rival ahead
- 3 level
- 1 unconfirmed
1What it is, and who it is for
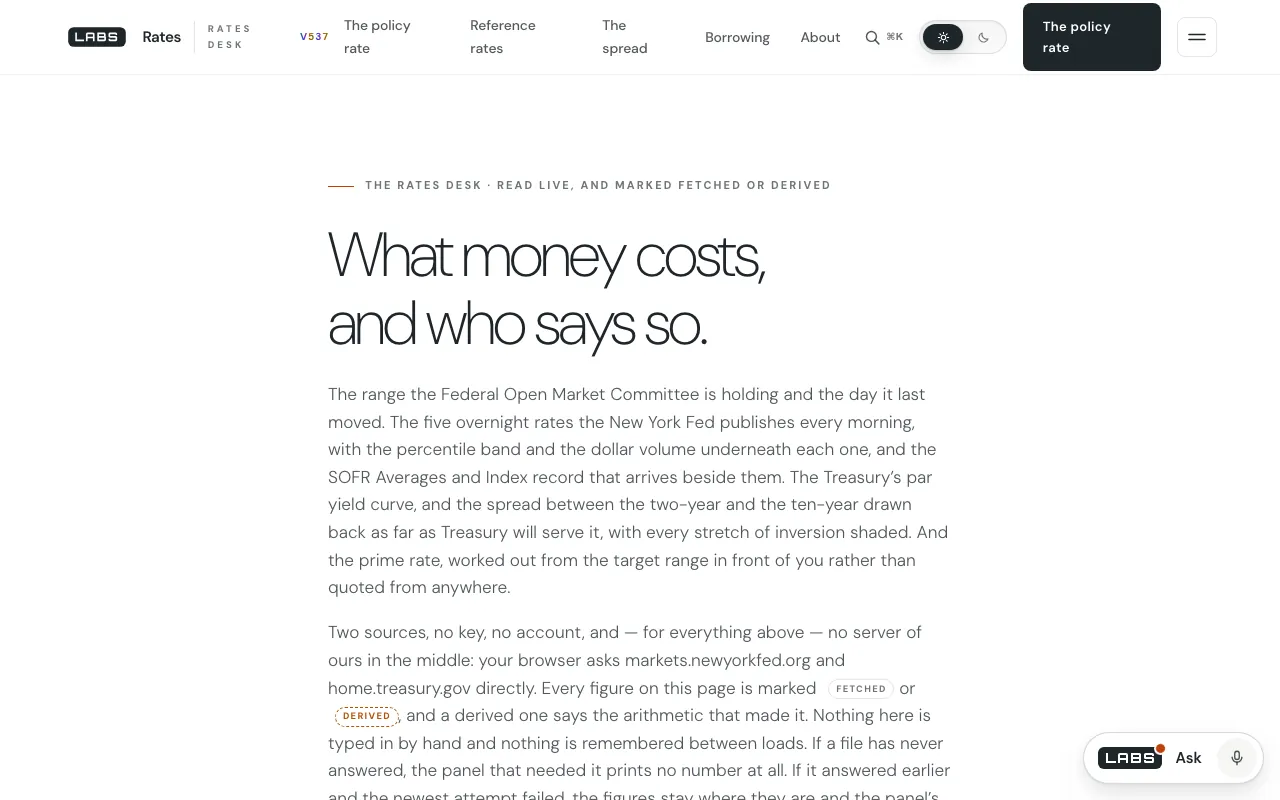
Rates is a desk for what money costs, read from the people who publish it: the Federal Open Market Committee's target range and when it last moved; the New York Fed's five overnight reference rates with percentile bands and volumes, plus the SOFR averages and index; the Treasury par yield curve with the two-year/ten-year spread drawn back to 1990 and every inversion shaded; a prime rate; and Freddie Mac's weekly mortgage survey.
It is for borrowers, savers, students of markets and journalists who want the official figures on one screen with each number's source named — not a commentary.
2How it works
Most of the reading happens in your browser. It calls the New York Fed's rates API directly (all/latest.json and an EFFR history search; rates/assets/js/app.js:63, 1488, 1503) and walks the Treasury's daily par-yield CSV one calendar year per request from 1990, three years in flight at a time (64–65, 1432, 1442–1443). Every request is made with cache: 'no-store' (277).
Prime is not read from anywhere. It is the target range's upper bound plus 3.00 points, the constant is commented as “a convention, not a rule and not a published rate”, and the panel shows the arithmetic (68–73, 1188–1196). Only the mortgage survey needs a relay, because a browser cannot read Freddie Mac's file directly: rates/pmms-relay.php fetches the PMMS history CSV, keeps the last 300 weeks, caches for six hours, serves a copy marked stale for up to a week if Freddie Mac fails, and remembers a failure for five minutes. It takes no parameters and has one hard-coded upstream.
3The test
Measured on 27 September 2026 (UTC). The two endpoints the browser calls were fetched with curl, one year of Treasury data at a time, exactly as the code builds them.
| UTC | What | What came back |
|---|---|---|
| 20:00:05 | The page | HTTP 200, 63,595 bytes. |
| 20:00:15 | Mortgage relay | HTTP 200, 12,338 bytes, 97 ms: 300 weeks from 2020-12-31 (30-year 2.67, 15-year 2.17) to 2026-09-24 (30-year 7.03, 15-year 6.42). |
| 20:02:36 | New York Fed, latest rates | HTTP 200, 1,427 bytes, 47 ms, six records: EFFR 3.88 (24 Sep) inside a 3.75–4.00 target range; OBFR 3.88; TGCR 3.86; BGCR 3.86; SOFR 3.88 on $2,990bn. The derived prime is therefore 4.00 + 3.00 = 7.00%. |
| 20:02:43 | Treasury years 2026, 1990 and 1989 | 2026: 185 rows, latest 25 Sep, 19.2 s. 1990: 250 rows, 17.2 s. 1989: HTTP 200 with an empty body, 19.3 s — the behaviour the code comment records (app.js:75–79). |
| ≈20:07 | Cross-check with the publishers | The Treasury's 25 Sep row gives 2-year 4.81 and 10-year 5.17, a spread of 0.36; FRED's T10Y2Y page shows 0.36 for that day. Freddie Mac's page shows 7.03% and 6.42% for 24 Sep, as the relay did. |
4The checklist
Eight checks. The two figure rows are where a desk like this is judged first, and it agreed to the hundredth. The rest split: Rates leads on putting everything on one screen, the publishers lead on history and on ways to take the data away.
- Yes: does it
- Partly: partly — read the note
- No: does not
- Not checked: not checked: no claim either way
- Not applicable: does not apply
| Check | labs.llc · under testRates | rivalFRED · T10Y2Y | rivalFreddie Mac PMMS |
|---|---|---|---|
| 2s10s spread for 25 Sep 2026Level | 0.36 | 0.36 | Not applicable |
| 30-year mortgage, week of 24 Sep 2026Level | 7.03% | Not applicable | 7.03% |
| Policy rate, overnight rates, curve and mortgages on one pagelabs.llc ahead | Yes | Partly1 | No2 |
| Every 2s10s inversion since 1990 shadedUnconfirmed | Yes3 | Not checked | Not applicable |
| Full history in one requestRival ahead | No4 | Yes | Yes5 |
| Mortgage history on offerRival ahead | 300 weeks | Not applicable | since 1971 |
| Downloads, an API or alertsRival ahead | No | Yes6 | Partly7 |
| Says how each figure was madeLevel | Yes8 | Not checked | Yes9 |
- 1One series on this page; FRED offers data lists, which we did not test.
- 2Freddie Mac's own survey only, by design.
- 3Including one-day inversions (app.js:393, 445–457).
- 4One Treasury year per request, 17–19 s each here; re-fetched every visit.
- 5A download of rates since 1971.
- 6Download, the FRED API, ALFRED vintages and email notifications.
- 7The 1971 download was confirmed; an API or alerts were not checked.
- 8Figures tagged by source field; prime marked derived, with the arithmetic.
- 9Methodology and FAQs on the page.
Does better
FRED · T10Y2Y
- The whole spread history as one series in one request.
- Downloads, an API, ALFRED vintages and email notifications.
- It publishes the next release date (28 September, when fetched).
Does better
Freddie Mac PMMS
- It is the authority for the figure, with methodology and FAQs.
- History back to 1971 as a download.
- The release time is stated: Thursdays at 12 p.m. ET.
Goes further
Rates
- Sets the policy rate, SOFR, the curve and the mortgage survey side by side, each read from its publisher.
- Labels prime as derived and prints the sum, rather than presenting a convention as a published rate.
- Shades every inversion since 1990 on the drawing itself.
- Keeps showing the mortgage survey through a Freddie Mac outage for up to a week, and says the copy is stale.
5Where Rates falls short
- Slow to fill the long history. Thirty-seven Treasury years, three at a time, at 17–19 seconds each from here, and nothing is cached between visits. FRED hands over the same spread as one series.
- Mortgage history stops at 300 weeks (from 31 December 2020), where Freddie Mac offers everything since 1971.
- No forward view. It shows what rates are, not what markets expect. CME Group describes its FedWatch tool as doing that from fed funds futures; the tool page timed out for us, so we only cite the description.
- Prime is an inference by convention — stated openly, but still not a published series.
- No downloads, alerts or API of its own.
6The verdict, by the checklist
Choose Rates to see what money costs across the whole system on one screen, straight from the publishers; choose FRED or Freddie Mac when you need the long history in hand.
The two rows that matter most for a figures desk — does it agree with the publisher? — came out level, to the hundredth, on the day we checked. After that the checklist divides cleanly. Rates is the better screen; the publishers are the better archive. The cost of reading the Treasury raw is time, and the review measured it.
Try Rates on labs.llc